Mapping six decades of vascular plant species richness change across Europe
App link: gmidolo.shinyapps.io/interpolated_s_change_app
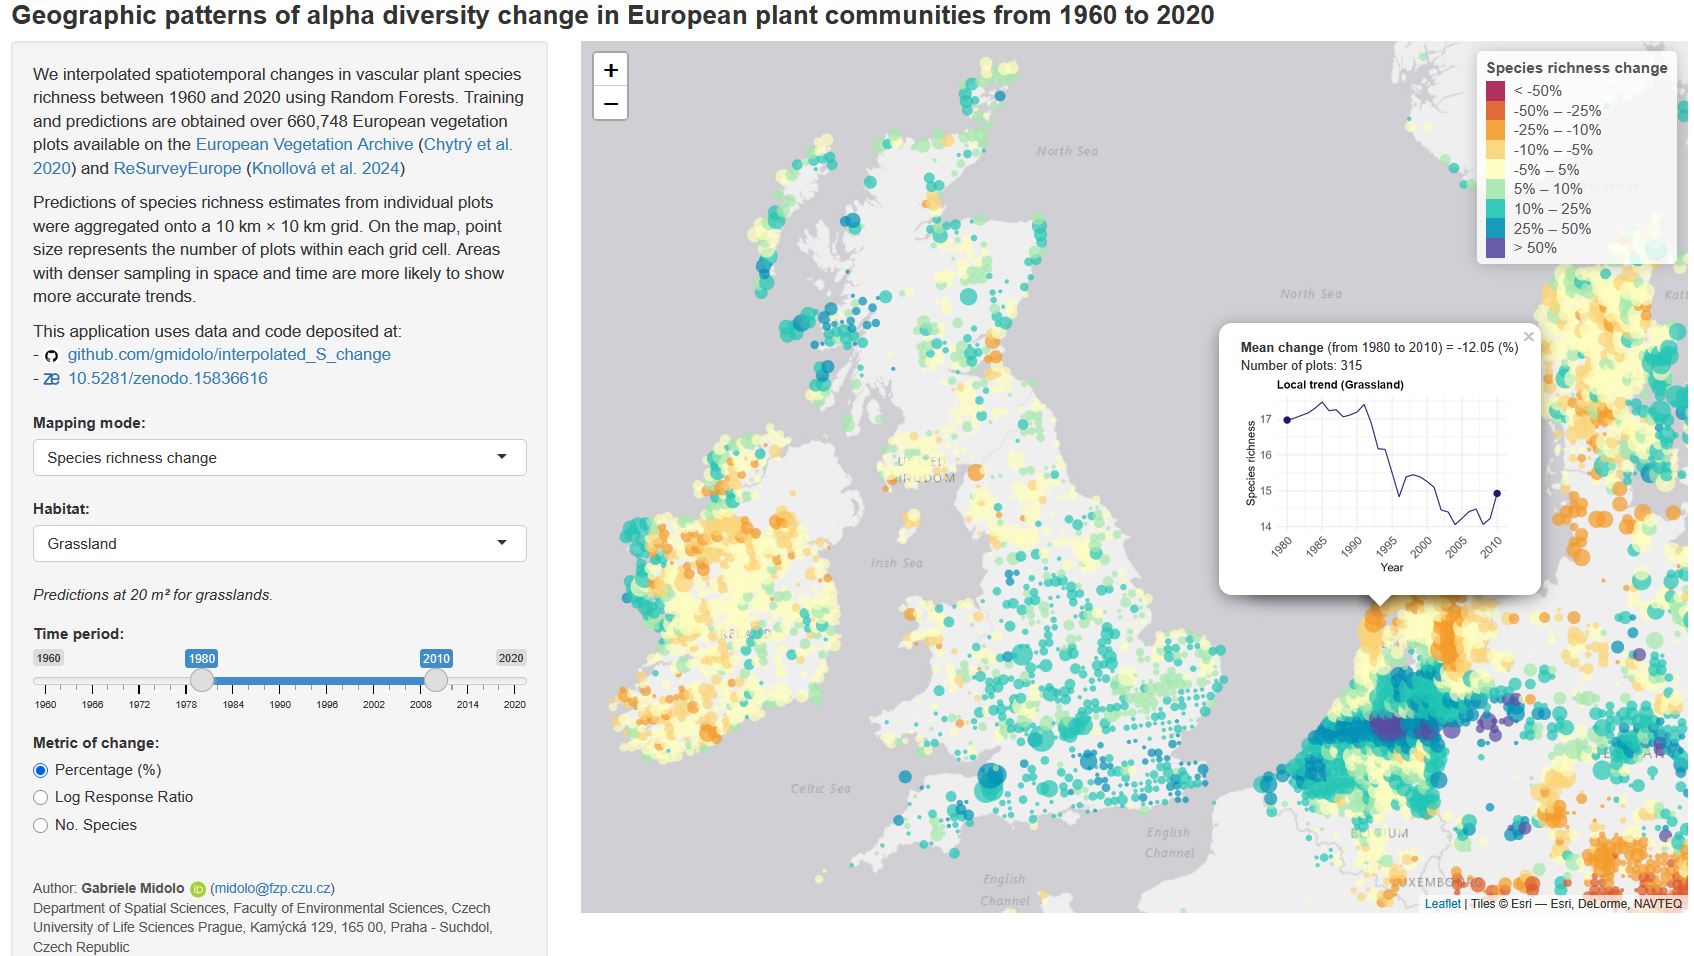
We interpolated spatiotemporal changes in vascular plant species richness between 1960 and 2020 using Random Forests. Training and predictions are obtained over 660,748 European vegetation plots available on the European Vegetation Archive (Chytrý et al. 2020) and ReSurveyEurope (Knollová et al. 2024).
Predictions of species richness from individual plots were aggregated onto a 10 km × 10 km grid. On the map, point size represents the number of plots within each grid cell. Areas with denser sampling in space and time are more likely to show more accurate trends.
This application uses original data and code deposited at:
- ![]() github.com/gmidolo/interpolated_S_change
github.com/gmidolo/interpolated_S_change
- ![]() 10.5281/zenodo.17357776
10.5281/zenodo.17357776
Paper: Midolo et al., 2025
Code: gmidolo/interpolated_S_change_app